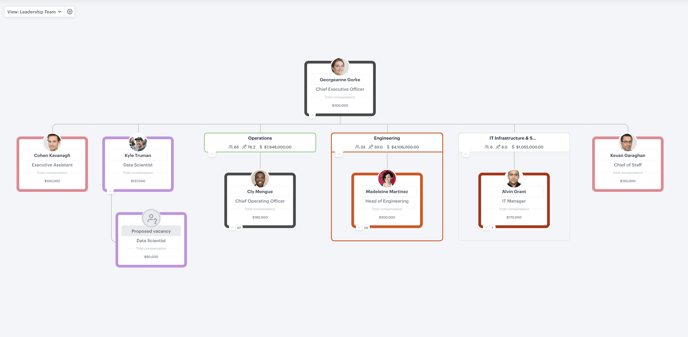
Whether your organization is growing, restructuring, or acquiring, start with your "current state" organizational chart.
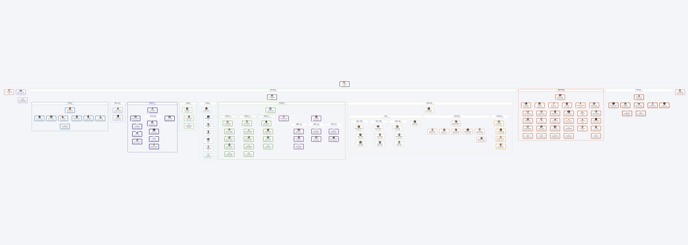
Why build an organizational chart?
Many customers present compelling reasons for developing a current state organizational chart, but the primary motivation typically centers on achieving organizational clarity to prevent confusion and disorder.
Often, organizational designers are aware that their companies are undergoing changes and approach this process thoughtfully, with a clear strategy and vision of what the organization should resemble in three, six, or even twelve months, or beyond.
Conversely, some designers and leaders share that their organizations have evolved "organically" without a consistent strategic framework. Now, they seek a clearer understanding of the current structure to make sense of it all and, if needed, to implement necessary changes.
In our article discussing insights from real-world organizational charts, such as those from Canva, Apple, and Spotify, we highlight that some organizations may continue to rely on structures that were effective in the past but are no longer suitable for their present circumstances.
Additionally, there are organizational designers and leaders who aim to clarify where individuals fit within the broader organization, eliminating any uncertainty about roles and responsibilities.
No matter which category you identify with—or if you belong to another— the first step in any organizational design process is to comprehend your organization as it currently exists. This understanding lays the groundwork for any future changes and helps mitigate potential confusion or disorder.
In the following sections, we will outline the steps and features necessary to create a current state organizational chart that is clear and easy for you and others to navigate.
Steps to create your current state org chart:
1. Add or Import your people
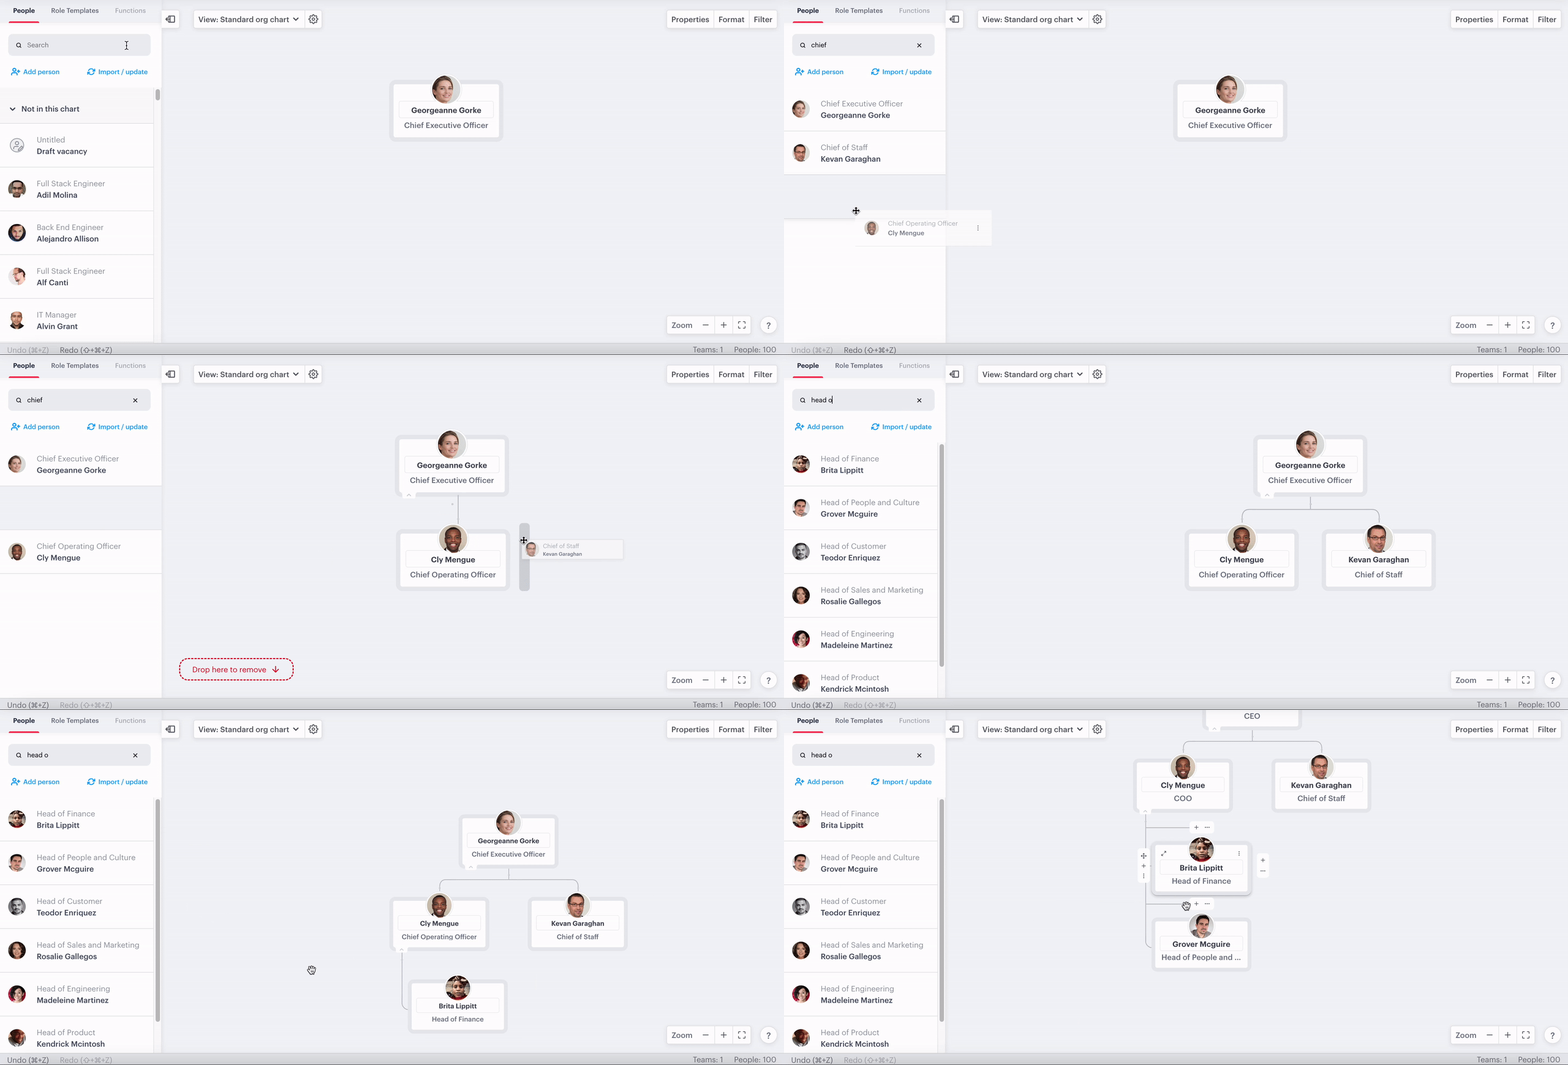
Importing your people into a structure or building a structure by dragging and dropping people will provide you with a basic layout and a starting point from which to add more detail.
Import options:
- Generate an org structure using a CSV
- Generate an org structure from your HRIS or Payroll System
- Build an org chart using drag & drop
Generate an org structure using a CSV
Using a CSV is a simple and effective way to generate a full org structure, so long as our import engine can discern a manager for each position in your spreadsheet. By reading the list of people and their managers, Functionly's import engine knows what the reporting lines should look like.
Check out everything you need to import an org structure including
- Download a demo CSV with all available data
- Prepare your spreadsheet
- Step-by-step guide to import your spreadsheet
- Import your custom properties
Need help importing your data? Our support team is ready.
Generate an org structure using an integration
We integrate with a long list of HRIS and Payroll Systems. As with our CSV import, so long as a manager can be detected for each person except the person at the top of your chart, our import engine should be able to generate a fully constructed org chart for you.
Steps:
- Open the scenario
- Click "import/update" in the left-hand menu or above the top position in your chart
- Select your chosen integration
- Choose "rebuild all" to import a new structure
- Proceed through the login page to connect your HRIS or Payroll System
View our integration page for troubleshooting or contact us via our support page or by emailing support@functionly.com
Build an org chart using drag & drop
While this may seem daunting for larger organizations, it's a great opportunity to view your organization on a forensic level and will provide you with a firmer understanding of the organizational structure in more detail. It's also a great opportunity to bring other people in to help with, and begin working collaboratively on the process.
💡To have your people appear in the left-hand menu for drag-and-drop, don't include any manager fields when importing your spreadsheet.
2. Change primary reporting lines
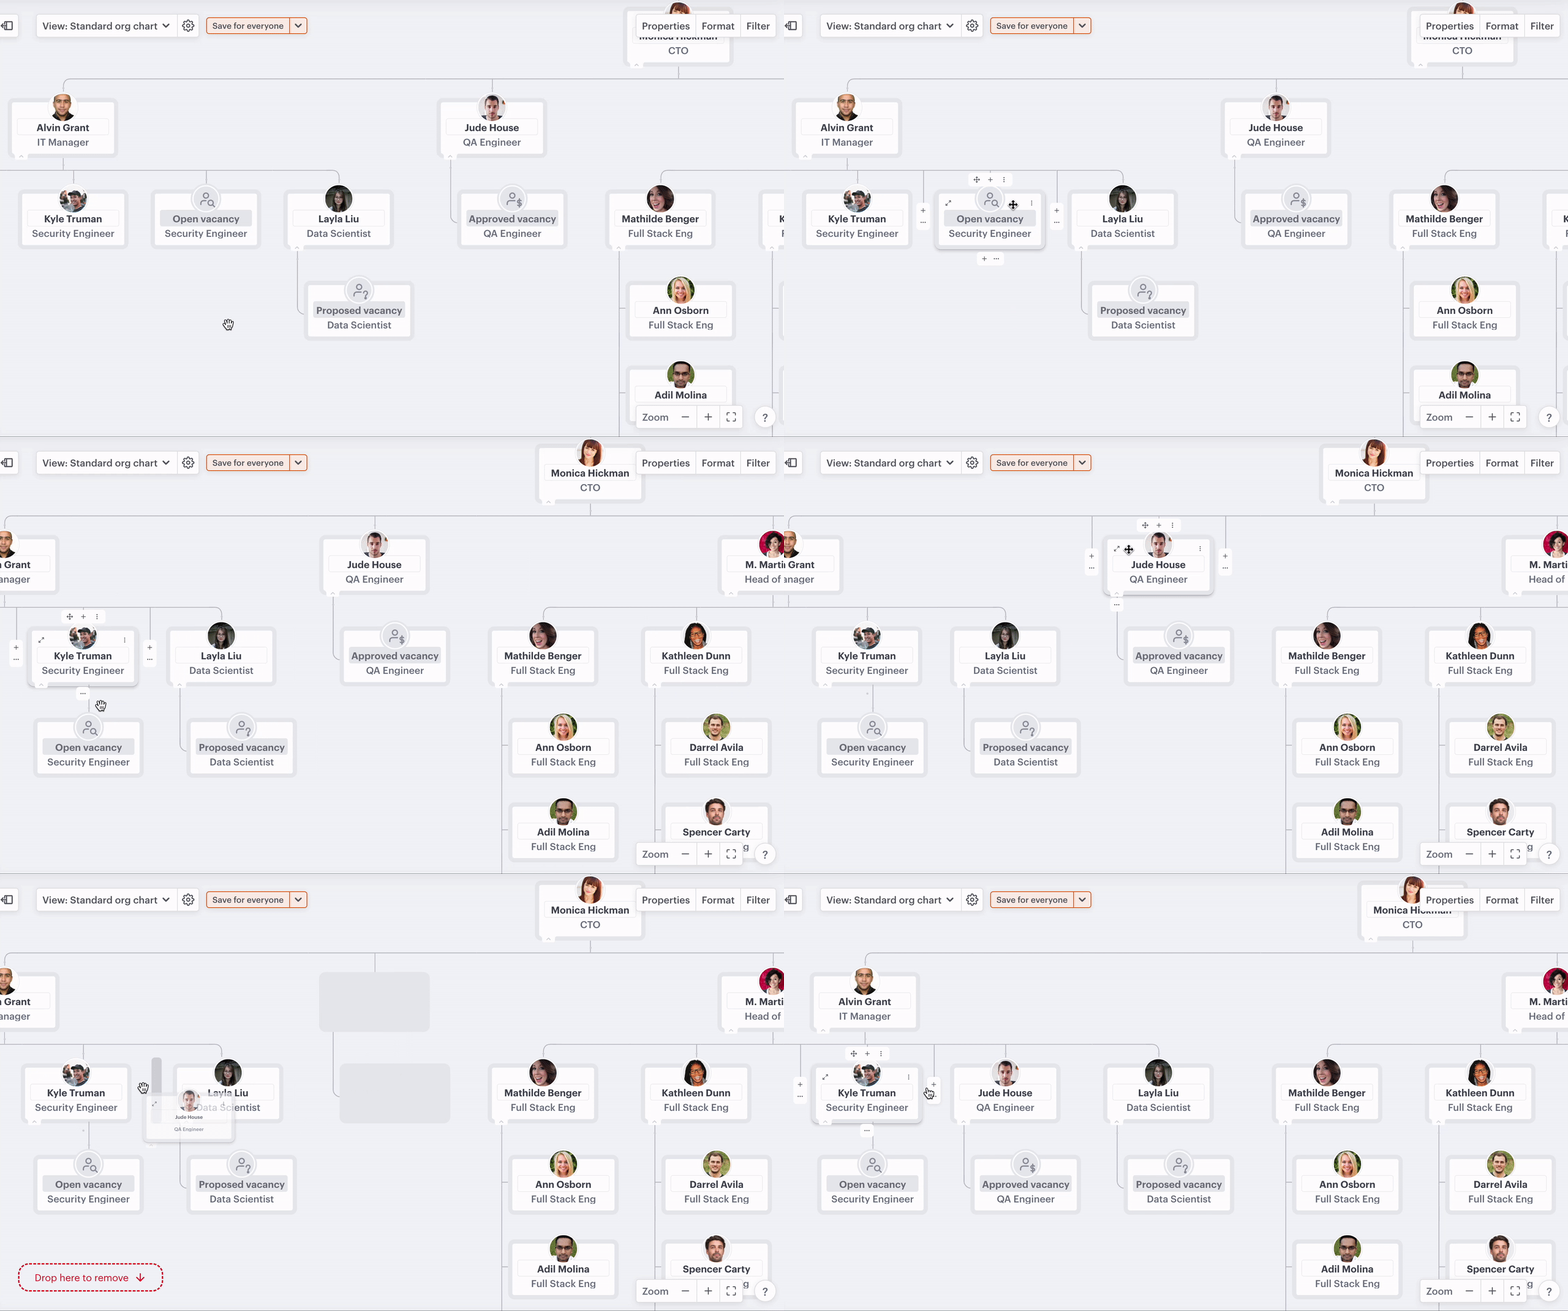
Whether you imported via CSV, integration, or built the entire org chart, you can easily change the structure using drag and drop.
Steps:
- Click and hold any position that you would like to move
- Drag it to its new location on the org chart
- Release the mouse button to drop
Want to create cross-functional positions?
Read here how to visualize positions with secondary (dotted-line) reporting.
3. Add groups to your organizational chart
Generating or building your org chart is step one, there are more features that make the org chart richer (and clearer), including groups. Groups allow you to visualize the departments, functional areas, teams, pods, or product lines in your organization.
If someone in your organization is viewing the org chart, groups make it easier to identify the area they're looking for.

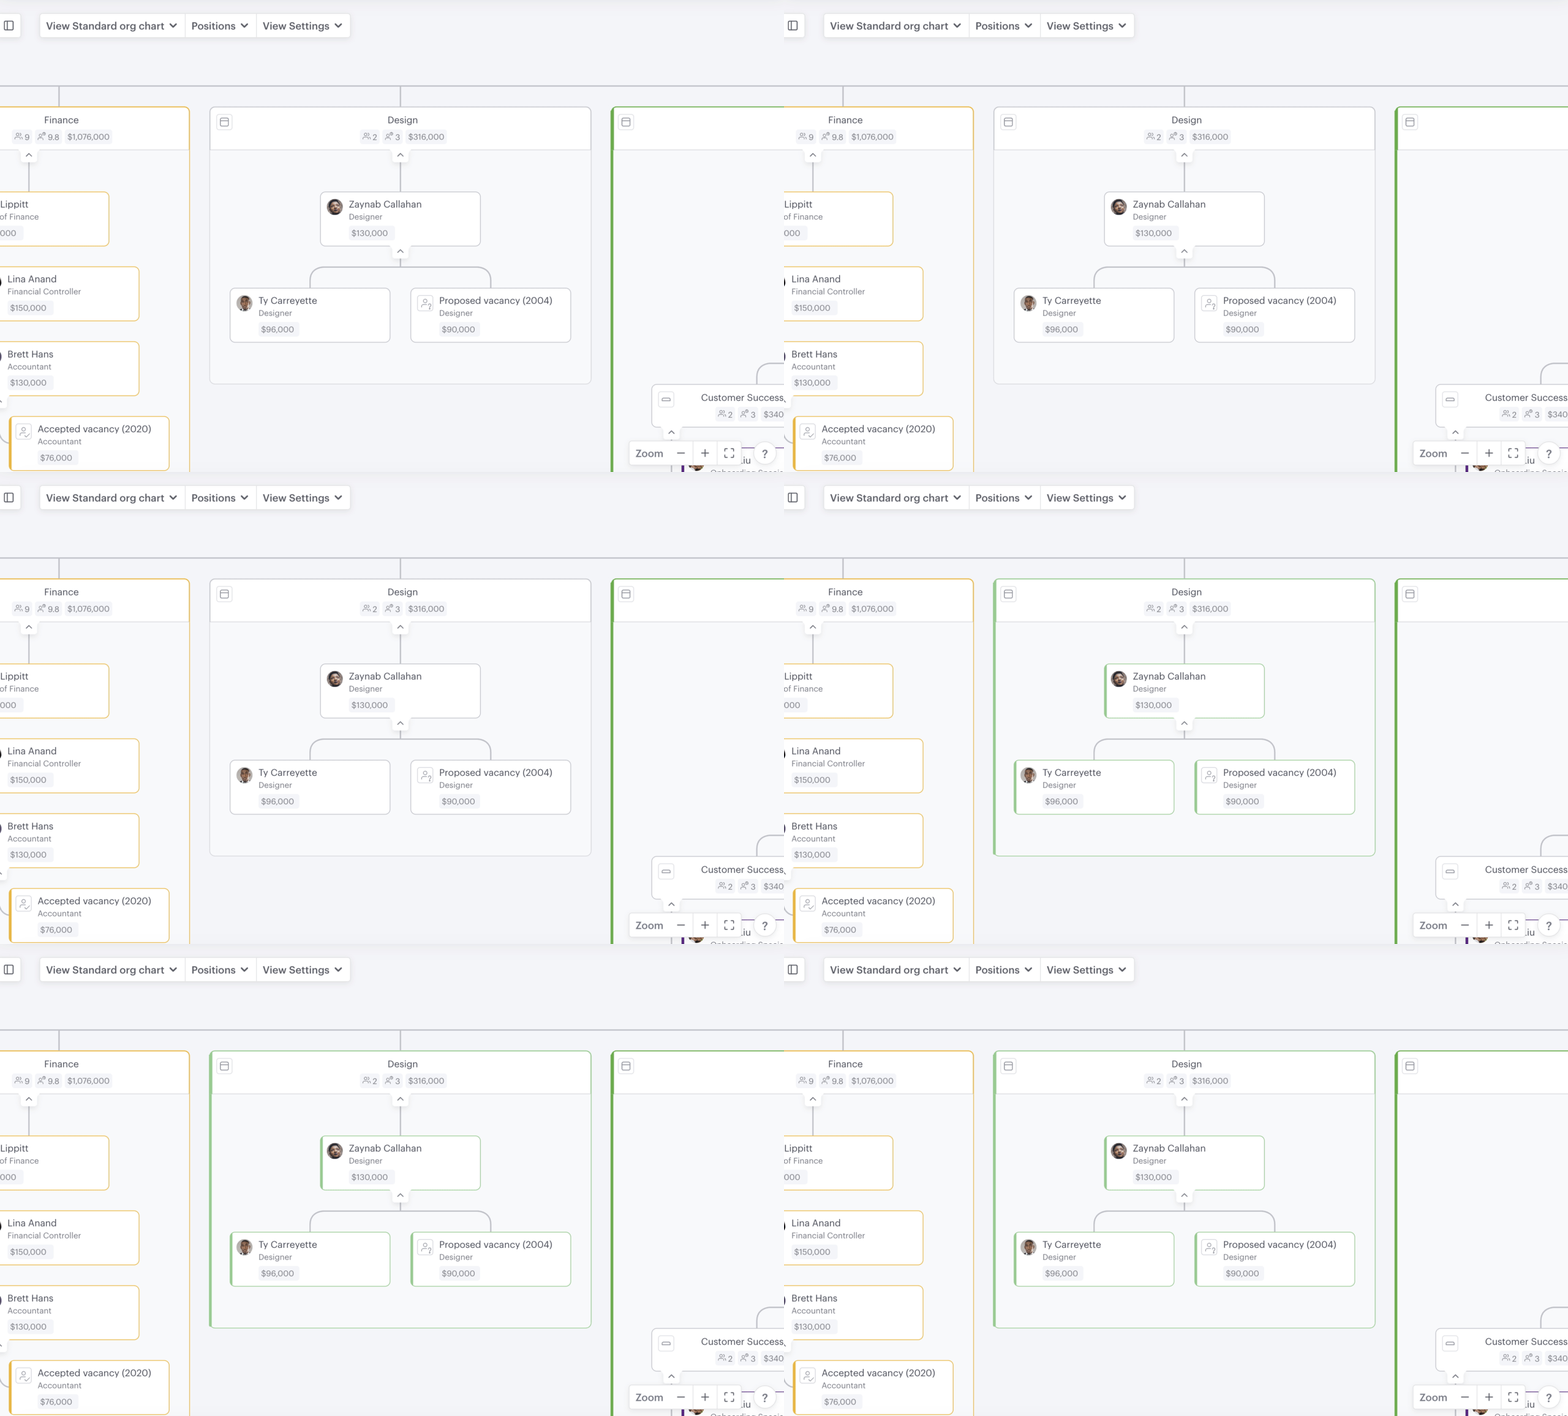
4. Color positions on your organizational chart
Coloring sections of your org chart makes it clearer where one part of your organization begins, and another ends, and coloring individual positions can communicate something important about a position to others viewing the chart. If building your org chart is the beginning of a bigger project, then color can be used to communicate detail about the different positions. For example, if you are building an org chart to help with a merger or acquisition, you may want to color based on the parent company of a position or if it's a position that's duplicated unnecessarily.
5. Share with others
Sharing your organizational chart with others is crucial, and you can tailor access based on their needs. Whether you want collaborators to edit all data, modify specific positions, or simply view the organizational structure, the sharing options allow for flexibility and clarity in collaboration.
Different ways to share your scenario:
6. Use custom properties in your organizational chart
Every company is different, and as such, every company is likely to have some unique information they want to capture for people and positions in their organization. Some of the more common use cases we see are location, pronouns, and employment status (permanent/contract).
Again, if building an org chart is a part of a bigger project like a merger or acquisition, then custom properties can be used to show a person's parent company, as well as many other practical applications.
7. Save a view of your organizational chart or set the default view
Saved views allow you to hone in on particular areas of your organization, focus on the data that matters and come back to it quickly again in the future. Saved views are also accessible to other collaborators, so when you want them to view something specific, perhaps a proposed change, they can see exactly what you're highlighting. If you want them to be able to see what you're talking about as soon as they open the org chart then you can set the view to be the default for all viewers, including those with share links.
