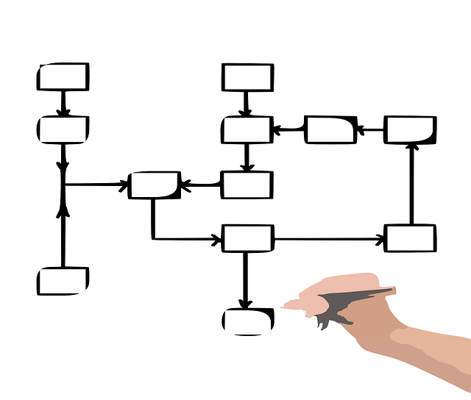
A business map is a visual representation of various processes and structures that keep your organization functioning. Mapping provides insights into the current state of your operations, but it can also be used to effectively plan for future growth or adapt to new scenarios.
Because different elements of a business can be mapped, there are different maps that you may choose from, depending on your goals. These are:
- Business process maps
- Organizational structure maps
- Business capabilities maps
While each type is useful for understanding your business, it’s important that you know the purpose of each mapping type and the scenarios in which you might use it.
Business Process Maps
A business process map is a visual representation of one of your company’s work processes. It may show the steps taken to create a product or deliver a service.
Business process maps may detail customer-facing products and services — for example, the steps taken to create a product.
They may also map internal products or services. You might have a map of the steps for responding to problem tickets sent by an in-house app used by sales staff, for instance.
Business Process Mapping vs. Business Process Modeling
It’s easy to confuse business process mapping with modeling. When you create a business process model, you focus on how processes are performed and who is performing them. The goal is optimization and future planning.
Business process mapping shows existing steps. This is helpful to create a clear understanding of the current state.
Types of Business Process Maps
There is no one type or format of business process map. Here are some of the most commonly used formats:
Flowcharts

A flowchart uses shapes, lines, arrows, and other icons to provide a graphic representation of a process. Three types of flowcharts are the most commonly used — top-down, deployment, and detailed.
Top-down flowcharts are simple, linear descriptions of the steps in a process. Deployment flowcharts detail who is responsible for each step or grouping of steps. A detailed flowchart combines both and provides a significant amount of detail.
State Diagrams
These diagrams use UML (United Modeling Language) to detail the series of events that may occur depending on the possible states that may exist.
Swimlane Diagrams
A swimlane diagram details who is responsible for each of the subprocesses within a process.
Data Flow Diagrams
A data flow diagram is most like a flowchart. It focuses on the information that flows through the steps in a process.
Organizational Structure Maps
Organizational structure maps detail how a company or business area within a company is structured. Also known as organizational charts, these maps may detail management structures, roles, and the flow of information within and between different elements in the structure.
Elements of Organizational Charts
Take a closer look at the elements you will find in an org chart.
Hierarchies
Several different management structures or hierarchies can be used to form an organization. An organizational chart provides information about the chosen hierarchy and how all of the functional areas work within that structure.
Teams, Divisions, and Business Areas
Depending on the management structure of an organization, it may be divided into different teams, divisions, or business areas.
Interactive demo: The "Functional Chart" view in Functionly includes a library of teams/functions and typical responsibilities.
In functional teams, individuals with related skills are grouped to perform a specific function or set of functions. Businesses may also form teams based on geographical location or responsibility for a particular product.
Roles
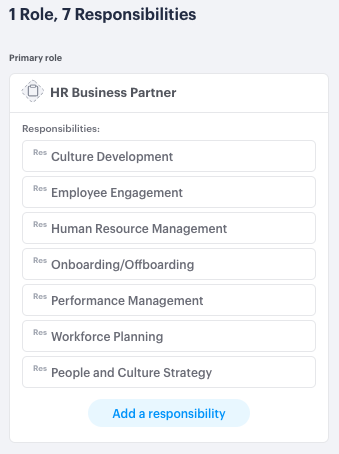
A role is a single position within a company and often within a team. The details of a role often include the skills and characteristics required and the outcomes that are created.
 View of a role in Functionly, showing assigned responsibilities.
Responsibilities
Responsibilities are the specific tasks assigned to a role.
It’s important to document roles and responsibilities in organizational mapping. This helps create a stronger understanding of who is responsible for what within an organization. You can also reveal gaps and redundancies by mapping these.
People
When a role has been filled by a person, the details can be represented in the organizational chart. These may include name, contact information, photo, etc.
Interactive organization chart template from Functionly
Business Capabilities Maps
A business capabilities map uses visuals to show the details of a specific capability or set of capabilities that an organization has. The difference between a capability map and other types of business function maps is that the focus is on what a business can do — its strengths or resources — and not on how those capabilities are being used.
Examples of Business Capabilities Maps
An organization’s capabilities can be described visually in many different ways. One way is to detail the capability and determine which areas within the organization use or benefit from that capability. Then, within that business area, you can drill down further into the specific outcomes that are generated because of that capability.
Another capabilities map will segregate capabilities into core or non-core categories. There are also internal and customer-facing capabilities. It is possible to map capabilities according to their impact on the organization. For example, does the capability help the organization innovate, stand out from the crowd, or make money?
Strengthen Your Company Knowledge Base with Maps
Functional business maps can be used for a variety of reasons. However, the most important aspect of any of these maps is the same. Each provides extraordinarily useful information about your organization. It’s worth using functional business mapping to create documents that can be added to your company’s knowledge base.


